Time-dependent speed profiles
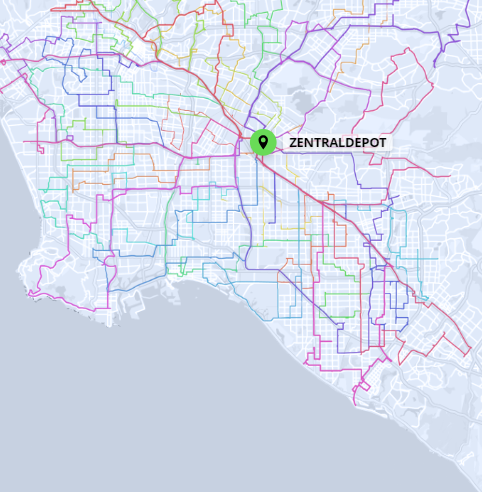
One of our unique features is using historical traffic density data in the optimization process. So for example, the Greenplan algorithm will take into account a traffic jam which always takes place on a certain intersection during the morning rush hour. This is one of the main reasons why Greenplan produces tour plans that are not theoretical constructs, but are accurate, practical and ready to be used by your drivers.
Why are speed profiles relevant
for tour planning?
Complications
Resulting needs
Congested streets and increasing travel times have a significant influence on delivery tours and compliance with delivery time promises
Traditional planning approaches consider only road size or speed limits, no other impacting factors like volume of vehicles, traffic lights or steep slopes
Not considering realistic average travel times makes planning results and calculated ETAs unreliable as this does not reflect reality
Consideration of real average travel speed, based on aggregated historical data
Relevant data granularity by using street-specific flow velocities depending on weekday and respective times of day
Consistent and compact data format globally to limit implementation effort
Complication
Resulting need
Congested streets and increasing travel times have a significant influence on delivery tours and compliance with delivery time promises
Traditional planning approaches consider only road size or speed limits, no other impacting factors like e.g. volume of vehicles, traffic lights or steep slopes
Not considering realistic average travel times makes planning results and calculated ETAs unreliable as this does not reflect reality
Consideration of real average travel speed, based on aggregated historical data
Relevant data granularity by using street-specific flow velocities depending on weekday and respective times of day
Consistent and compact data format globally to limit implementation effort
Sample Case Study – Deliveries in a
Metropolitan Area
A transition from planning in fixed districts (geofences) to a global tour planning and
optimization without districts is often difficult to achieve in a single step
Initial situation
SOLUTION PROVIDED BY GREENPLAN
How does our solution compare to tour
planning without consideration
of speed profiles?
A transition from planning in fixed districts (geofences) to a global tour planning and optimization without districts is often difficult to achieve in a single step
Scenario comparison
Planning tours without speed profiles, i.e. assuming no traffic at all, leads to significantly (-19%) reduced driving times.
But such an approach is too optimistic: if we retrospectively “turn on” the actual traffic for the optimistic schedule by applying real average travel speed, it results in much higher driving times.
Drive time is even higher (+2%: 2970 vs 2910 min) than in realistic scenario – considering speed profiles already during planning leads to a different tour structure (i.e. using primarily streets during low-traffic time intervals).
Example: Single tour
To give a taste of the actual implications for a single tour, here is a comparison of the simulated delivery times. The circles indicate delivery timestamps and the bar chart shows a delay for each shipment (traffic vs no traffic plans). Note how the delays are accumulating unevenly from stop to stop.
Results
Comparing delivery times of optimistic planning and actual execution, shows how significant delays would be – thus missing promised ETAs by 24 minutes on average!
70% of the shimpents are late by at least 20 minutes, with a maximum delay of more than an hour – 75 minutes.
Benefits provided
Considering speed profiles
when planning tours enables:
Compact and consistent
data format: